|
Lucas Signatone QuadProII Resistivity System
- Measures V/I, Sheet Resistance, Resistivity or Thickness
- Reports Average, Standard Deviation, Minimum, Maximum and 1Sigma for the data set
- Temperature coefficient of resistance (TCR) measurements integrated with automated temperature chuck and source meter (optional).
- Automated 2D Color Contour mapping, 3D and Cross section mapping
- Employs the dual configuration testing method for improved accuracy and repeatability
- Tests samples 10mm to 300mm
- P/N Typing
- Comparative Mapping
|
 |
|
| |
 |
QuadProII Resistivity System
Click image for larger view |
 |
|
| QuadProII Automatic System |
 |
|
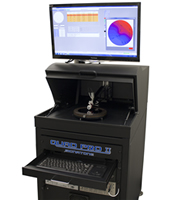
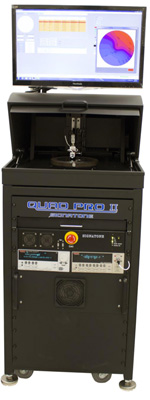
The QuadProII
automatic includes a computer, stepper controller, and base station with either a 200 or 300mm diameter isolated chuck. The software automatically defines the points for automated testing and mapping of the test sample. The user enters the sample size, sample shape, edge exclusion, and choice of 5, 9, 25, 49 or 121 test points. The software automatically defines the best probe position for creating a uniform contour map. Users may also define their own custom positioning map with up to 14,000 test points. The user map may be defined by moving to position and recording the location or keying X-Y positions into an X-Y position table.
With AutoRange mode enabled, at the first measurement, the QuadProII steps the current source through a number of settings, finding the best current setting for testing the sample under test. All subsequent test positions use the same current setting. With Dual Configuration mode enabled, at each site, 4 different measurements are made applying the dual configuration (ASTM Standard F84-99) assuring that errors introduced by the probe head and edge proximity are eliminated. This greatly increases the repeatability and accuracy of measurements. The QuadProII automatically steps to each position and records the X-Y position, Sheet Resistance, Resistivity, Thickness and
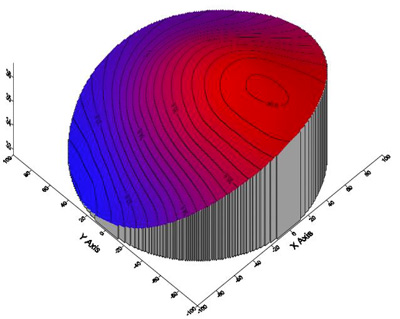
V/I measurement in a visible table. Upon completion of the test points, a wafer contour map is displayed. The contour map may be toggled between 2D color, 3D full scale and 3D cross section viewing. Statistical data including the average, standard deviation, 1Sigma, maximum and minimum measurement results display prominently above the contour map. The results may then be printed or exported to a spread sheet for further analysis.
|
|
 |
| QuadProII Automatic System |
 |
|
After the automated testing, the contour maps are displayed. The 2D contour maps are displayed in black and white or colored regions. 3D graphs may be plotted in full scale or a cross section. Cross section maps may be defined on the X or Y axis. When the QuadProII is connected to a printer, the user selects the desired maps and summary to print.
The data may be printed or exported as a delimited ascii file. Printing provides a choice of graphs and the data table.
 |
| 3D Contour Map |
QuadProII TCR Option
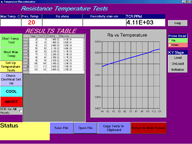
The Temperature Coefficient of Resistance option integrates temperature control of the test sample as well as the automated source meter control and resistance calculations. Integrated with a Signatone thermal chuck system, the test automatically steps through the test temperatures without moving the probe tips. Measurements are taken at each of the target temperatures and results plotted on the graph. TCR is reported in PPM.
Users define the temperature range, temperature steps and dwell or settling time at each temperature before making a measurement. A variety of Signatone thermal chucks are available to define range and resolution with a range of ambient to 300°C, 1° resolution.
For example, a typical test would be set at a range of 50°C to 250°C with 25° steps, dwell time of 5 minutes. The QuadProII would automatically measure the resistance at 20°C (the reference temperature) then control the chuck to heat to 50°C. After dwelling 5 minutes at 50°C, a measurement is then taken, recorded and plotted on the graph. Next, the chuck is heated up to 75°C for the next step measurement. This process repeats until the last measurement at 250°C is complete. The chuck is then automatically cooled back to ambient. Then, if so defined, additional locations may be automatically tested on the same sample. Up to 9 points on a sample may be automatically tested and graphed. The data may be printed or exported to a spread sheet for further analysis. |
|
<< Back to Lucas Labs Resistivity |
